
Moving averages are not just some colorful lines on your chart. They can be a great tool used in your trading strategy. Today, we will learn something new about one specific moving average type called the exponential moving average (EMA).
What is the exponential moving average (EMA) in trading?
There are four types of moving averages: simple, exponential, smoothed, and linear weighted. Their main difference lies in the sensitivity to changes in the data used in their calculation.
Exponential moving averages (EMAs) provide a higher weight to recent prices, while simple moving averages (SMAs) give equal weight to all values. Since EMAs gives more weight to recent data than to older data, they are more reactive to the latest price changes than SMAs. That is why some traders prefer this type of moving average.
Simple MA vs exponential MA
The exponential moving average (EMA) and the simple moving average (SMA) are both technical indicators that use past data to generate a smooth trend line for the security price. The difference between the two moving averages is that the EMA places a greater weight on recent prices, whereas the SMA places equal weight on all data points, resulting in the EMA line turning faster than the SMA line.
None of the moving averages is better than others. The optimal moving average to use for analysis depends on your trading strategy.
Although an EMA is a more accurate representation of recent price movements and helps identify trends quicker, it also experiences more short-term fluctuations than an SMA.
How to calculate the exponential moving average (EMA)
The EMA’s calculation is a little more complicated than the calculation of a simple MA. First, you need to calculate the simple moving average.
SMA = the sum of the closing prices for the number of time periods / the number of periods
Then, you need to calculate the multiplier for the smoothing / weighting factor for the previous EMA.
Multiplier = 2 / (the number of periods + 1)
Finally, you’ll arrive at the exponential moving average for the current period.
EMA for the current period = (closing price - EMA for the previous period)*multiplier + EMA (previous period)
You may use the SMA as the EMA for the previous period if you’re calculating the EMA for the first time.
In this technological age, we do not need to calculate moving averages ourselves. The computer does it for us.
How to set up the EMA
You can view the EMA in your chart in the FBS app by selecting the chart you want to apply it to, then opening the indicators. Find the EMA, set the desired timeframe, and apply it to your chart. Now you can easily analyze price movements relative to this indicator on your chart.

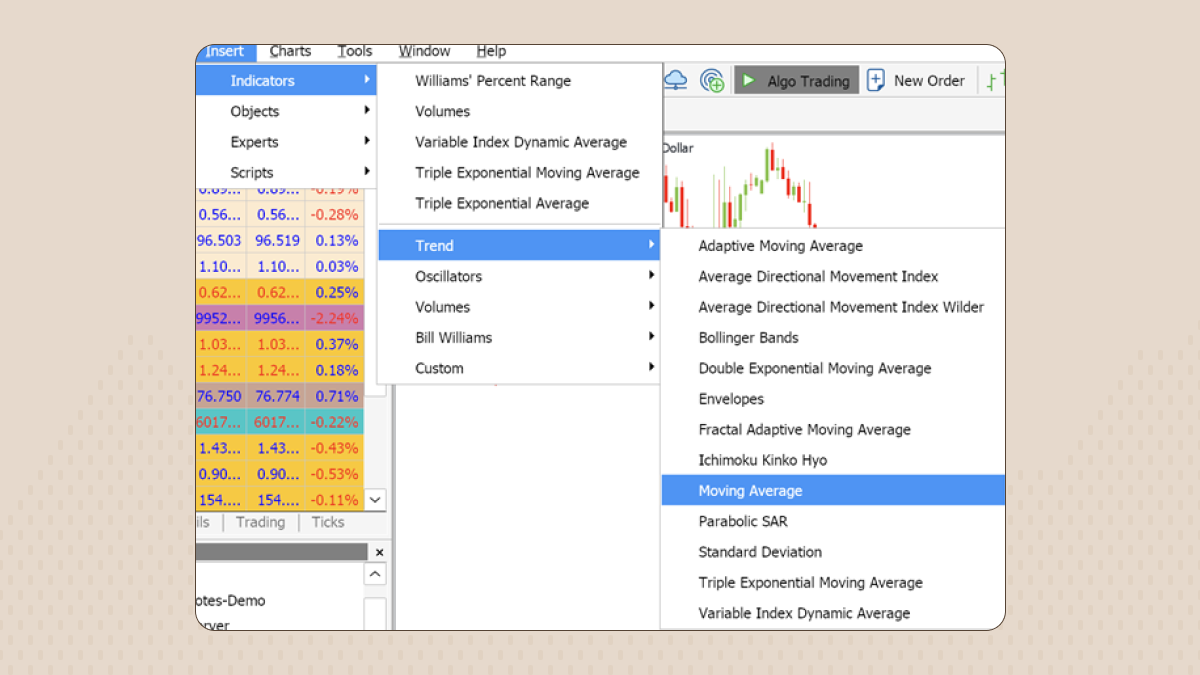
To apply the exponential moving average to your chart in both MetaTrader 4 and MetaTrader 5, choose Insert – Indicators – Trend. Then you need to click on the Moving Average button and change the MA method to Exponential.
You can also choose the period, method, and even the color of the EMA.
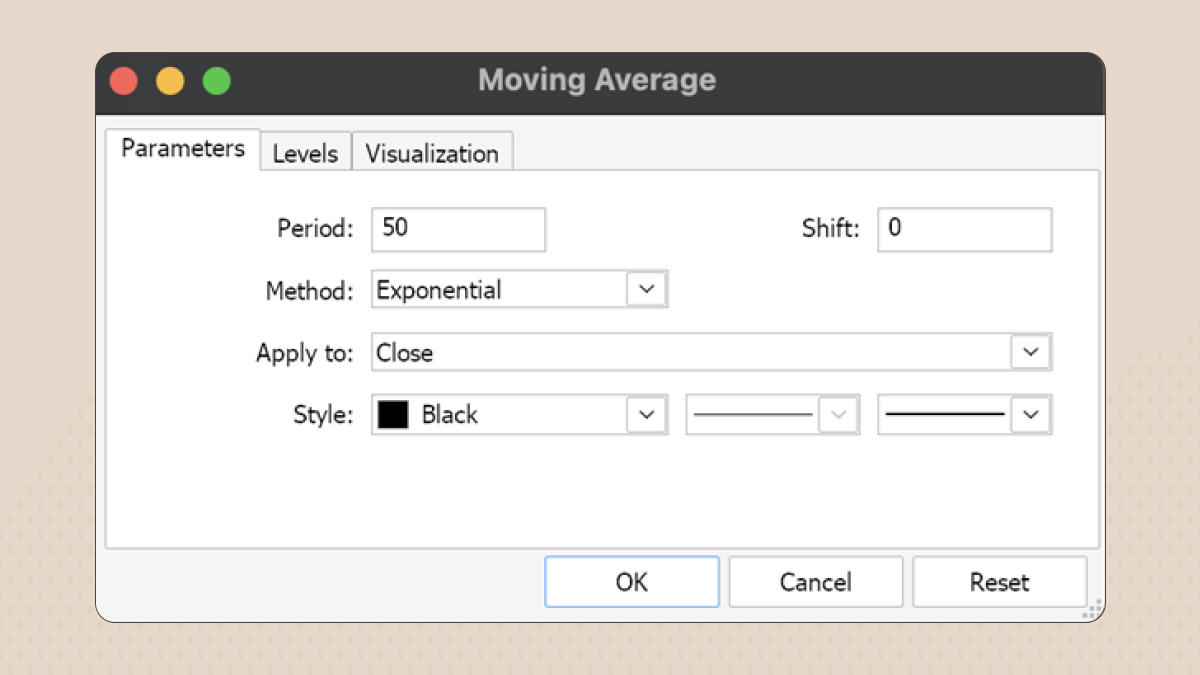
Experienced traders usually calculate EMA according to the close price.
The 8- and the 20-day EMA tend to be the most popular periods for day traders, while the 50 and the 200-day EMA are better suited for long-term investors.
Trading with the EMA
The EMA ribbons strategy
Traders sometimes watch moving average ribbons, which plot many moving averages onto a price chart rather than just one moving average. Though seemingly complex, EMA ribbons are easy to see on charting applications and offer a simple way of visualizing the dynamic relationship between trends in the short, intermediate, and long term.
Traders and analysts rely on moving averages and ribbons to identify turning points, continuations, and overbought/oversold conditions, define support and resistance areas, and measure price trend strengths.
To construct a moving average ribbon, plot many moving averages of varying time period lengths on a price chart. Common parameters include eight or more moving averages and intervals that range from a 2- to 400-period moving average. The most popular EMA ribbon consists of eight lines from the 20- to the 55-period.
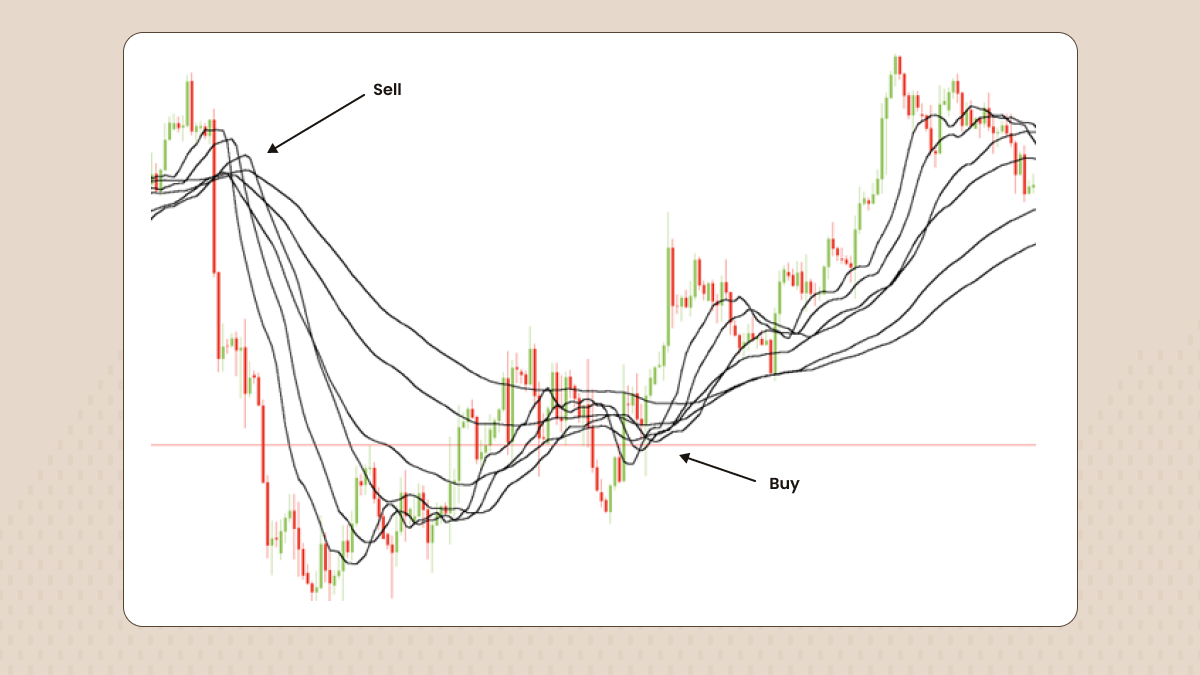
When all the moving averages converge into one point on the chart, the trend strength might be indicating a weakening, pointing to a reversal. The opposite is true if the moving averages are fanning and moving apart, suggesting that prices are ranging and that a trend is strong or strengthening.
In downtrends, shorter moving averages cross below longer moving averages. In uptrends, conversely, shorter moving averages cross above longer moving averages.
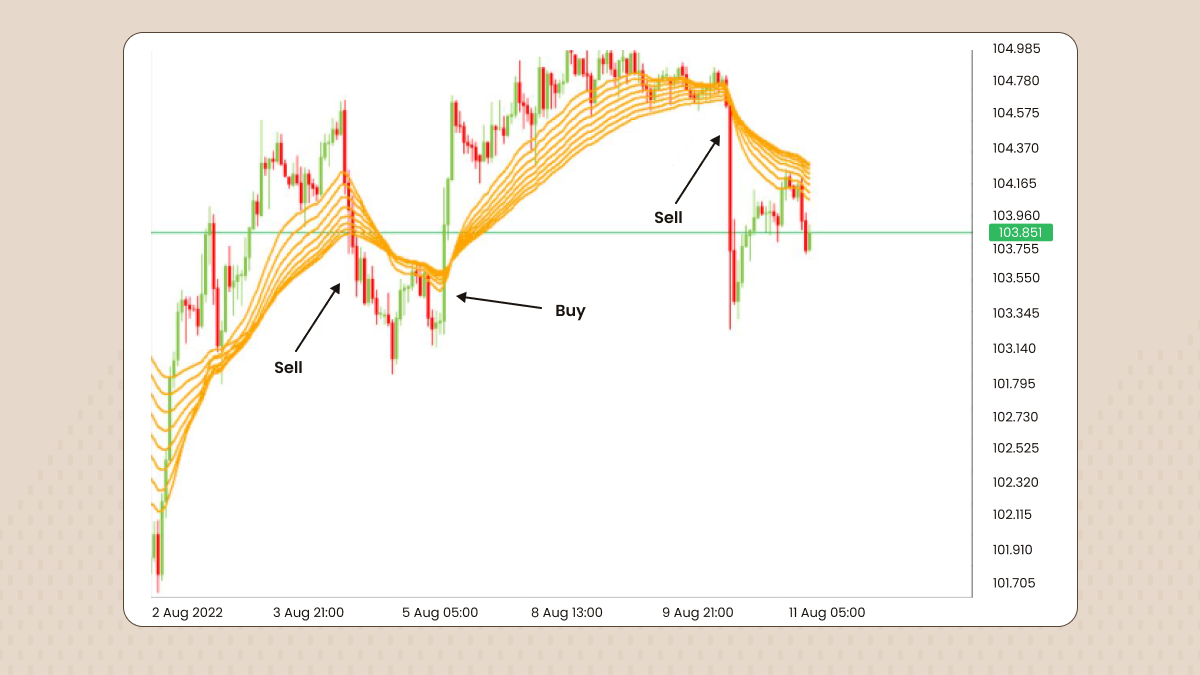
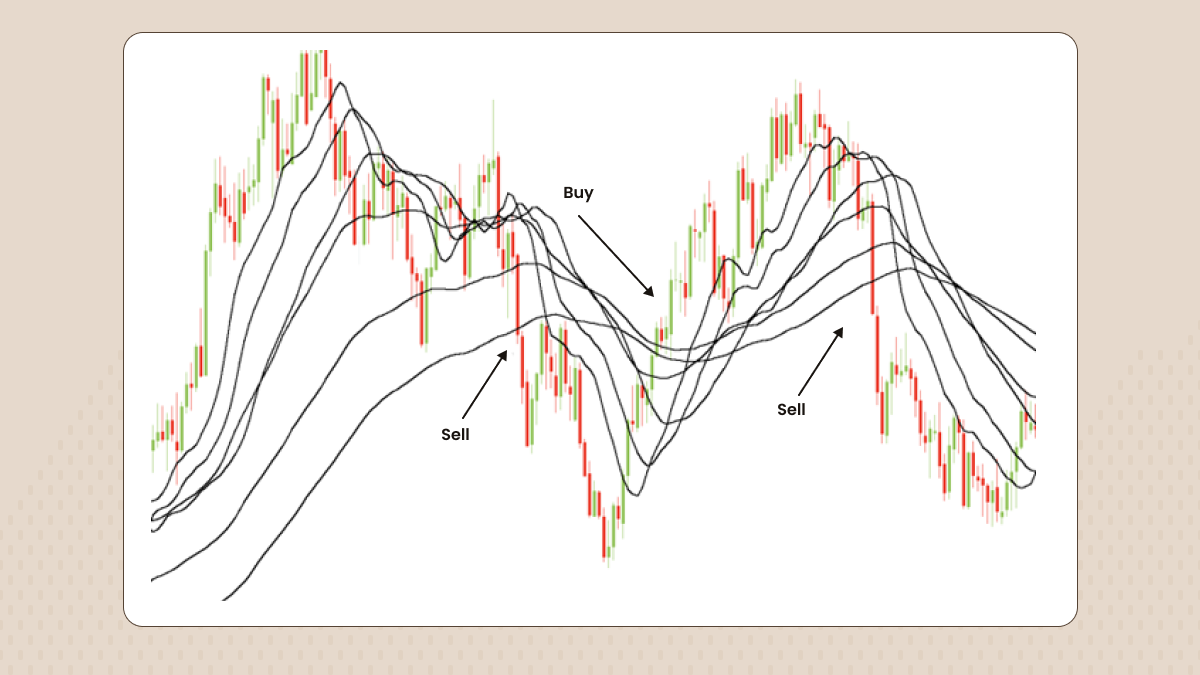
Moving average ribbons are easy to interpret. The indicators trigger buy and sell signals whenever the moving average lines all cross at one point. Traders look to buy when shorter-term moving averages cross above longer-term moving averages from below and sell when shorter moving averages cross all other lines from above.
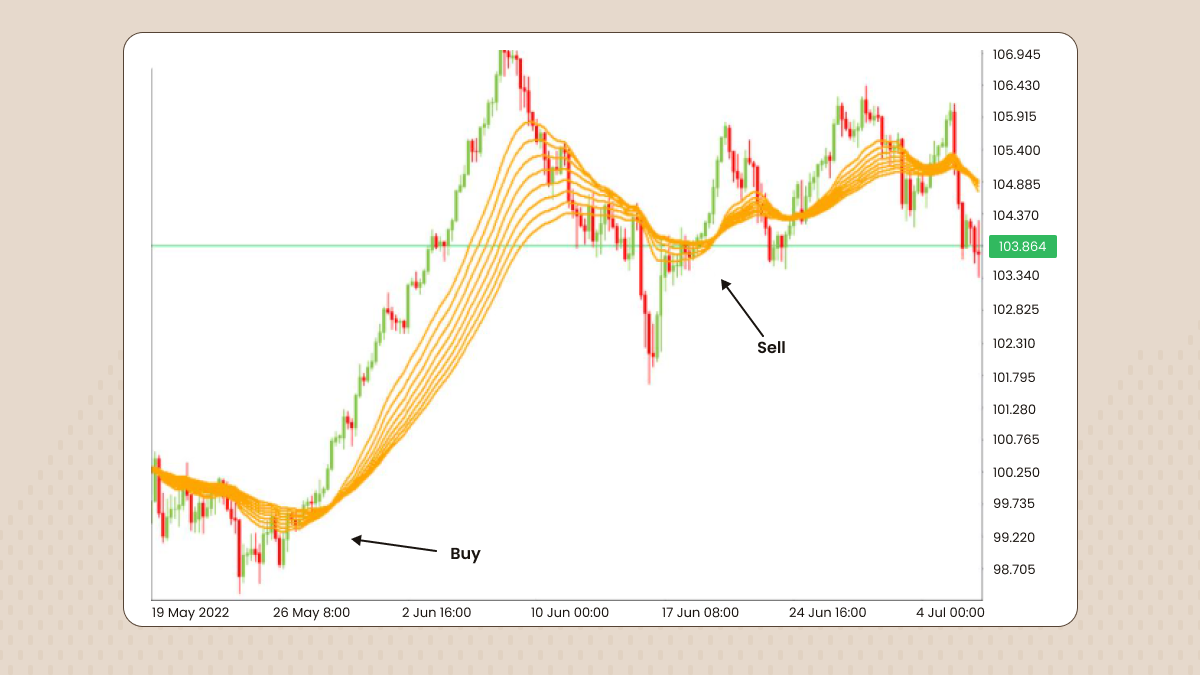
Moreover, traders use the EMA ribbon as a support and resistance level:
If during an uptrend the price breaks and closes the candle below the EMA ribbon, it’s a sell signal.
Vice versa, if during a downtrend the price breaks and closes the candle above the EMA ribbon, it’s a buy signal.
Important: For ease of analysis, keep the type of moving average consistent across the ribbon. Use only EMAs or SMAs.
The two-EMA strategy
The strategy listed below is perfect for swing traders. We suggest you use the H1 timeframe. It fits the strategy the best, since using two EMAs on lower timeframes might create lots of interrupting noise.
A strategy for opening a long position:
Wait for the short EMA to cross the long EMA to the upside.
Wait for other confirmations (break of the key level).
Place your stop-loss behind the last high or low.
Track the direction of the moving averages.
Close your position after the short EMA crosses the long EMA to the downside or the price reaches your target.
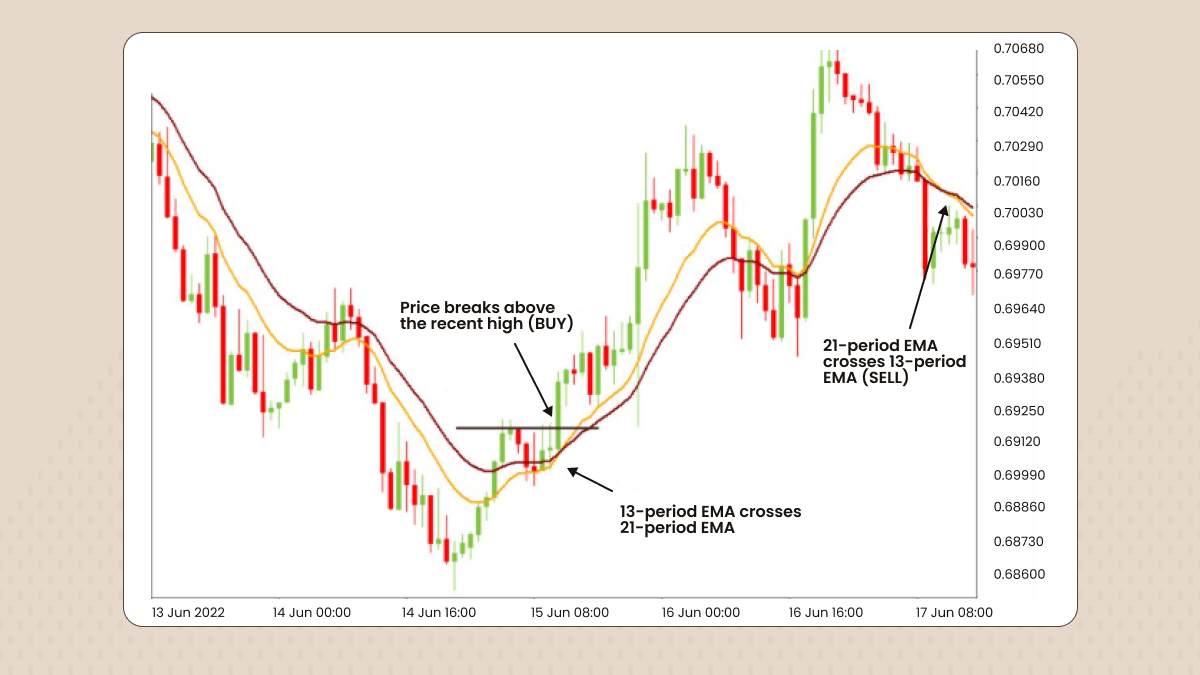
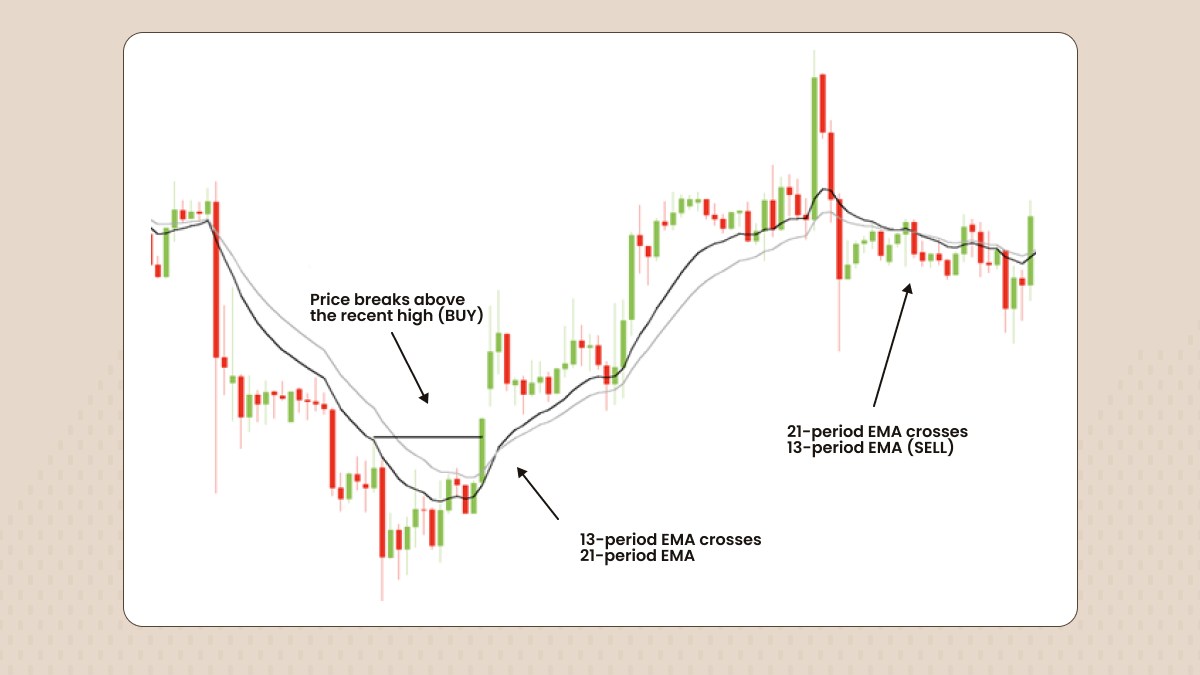
If the black line (short EMA) crosses the grey line (long EMA) to the downside, this may signal an opportunity to open a sell trade. You need to close your position when the short EMA crosses the long EMA to the upside.
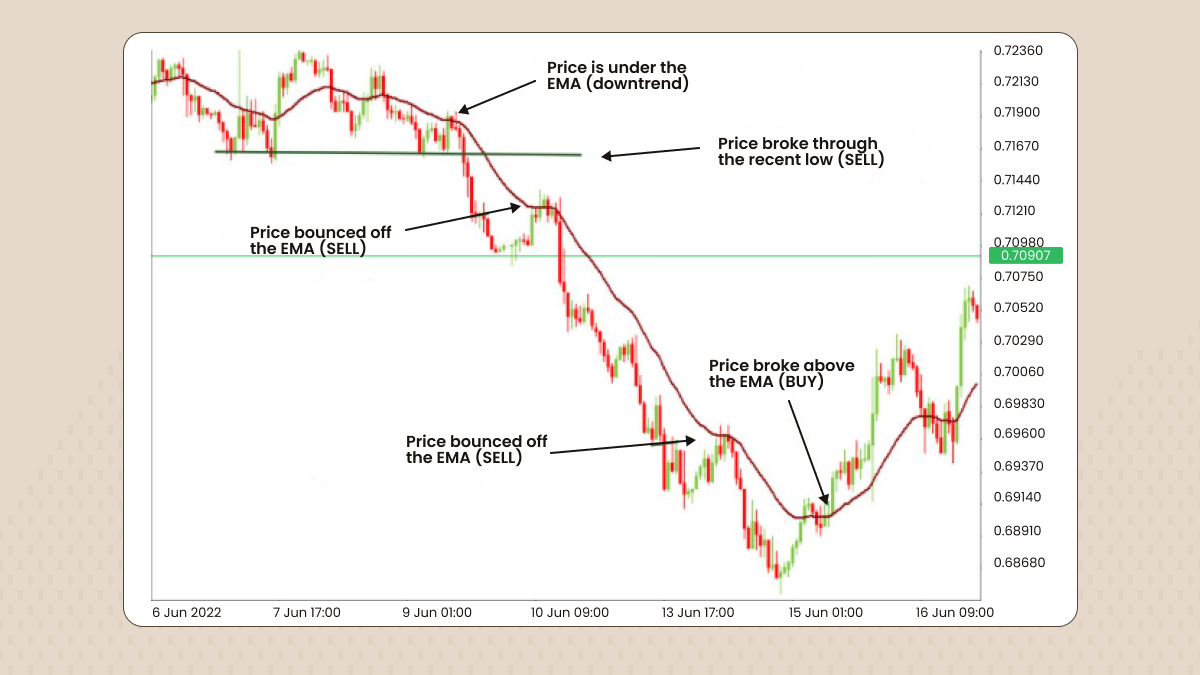
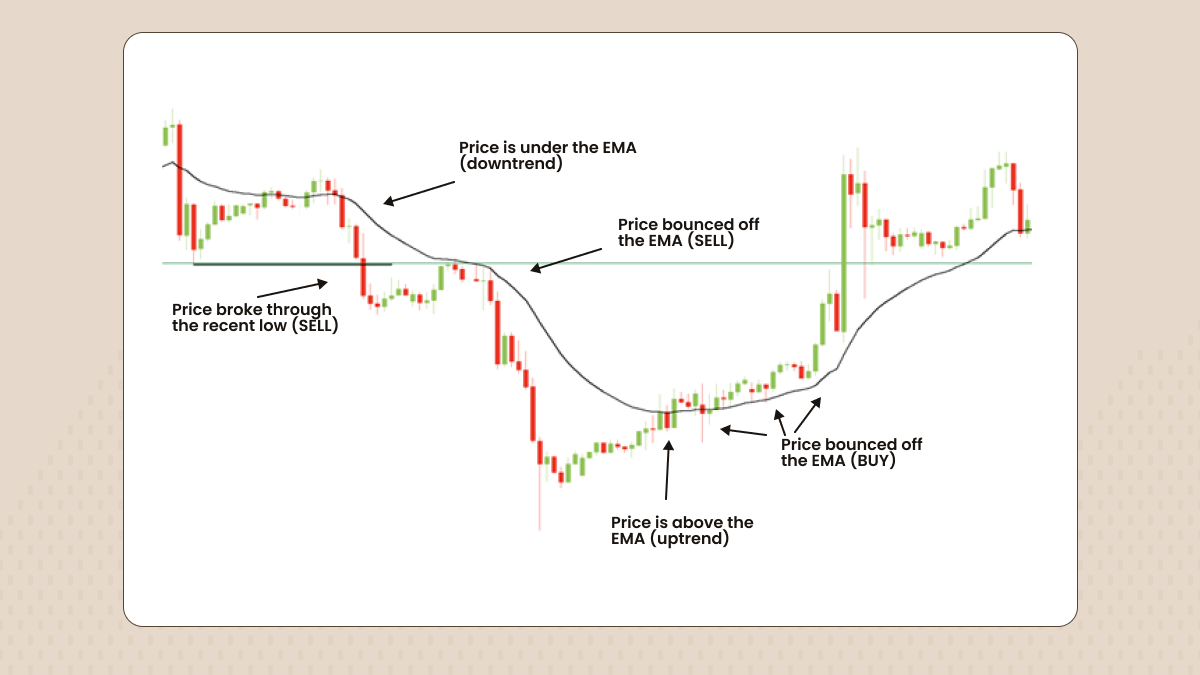
The EMA can be used as a dynamic support and resistance
Moving averages can also indicate support and resistance areas. A rising EMA tends to support price action, while a falling EMA tends to provide resistance to price action. A trader should open a buy trade when the price is near the rising EMA and sell when the price is near the falling EMA. For this strategy, 25 EMA on H1 works best.
Summary
The preferred number and type of moving averages can vary considerably between traders, depending on their investment strategies and the underlying security or index. But EMAs are especially popular because they give more weight to recent prices, lagging less than other averages. There are many great strategies including the EMA, and the EMA ribbon is one of the most useful tools traders use to find an entry point and stop market reversals.