
Fundamental Analysis
Since the beginning of 2025, oil prices have exhibited a downward trend, which has intensified from mid-February through March 5. This decline is attributed to several fundamental factors affecting the crude oil market's supply and demand sides.
On the supply side, OPEC+ announced plans to increase oil production starting in April 2025, marking the first adjustment since 2022. The group agreed to raise output by 138,000 barrels daily each month, aiming to restore full production by next year. This decision surprised investors who had anticipated an extension of production cuts, contributing to bearish pressure on prices.
Regarding demand, recent trade tensions have heightened global economic uncertainty. On March 4, President Donald Trump imposed 25% tariffs on imports from Canada and Mexico, and increased tariffs on Chinese goods. These actions have raised concerns about an economic slowdown that could dampen oil demand.
Key Takeaways
- Supply Increase: OPEC+ plans to boost production in April, potentially leading to an oversupplied market.
- Trade Tensions: New U.S. tariffs on Canada, Mexico, and China escalate economic uncertainty, negatively impacting crude demand.
These combined factors have accelerated the decline in oil prices in recent weeks, reflecting the market's sensitivity to global supply and demand changes.
Technical Analysis
XBRUSD, H4
- Supply Zones (Sell):
- Demand Zones (Buy):
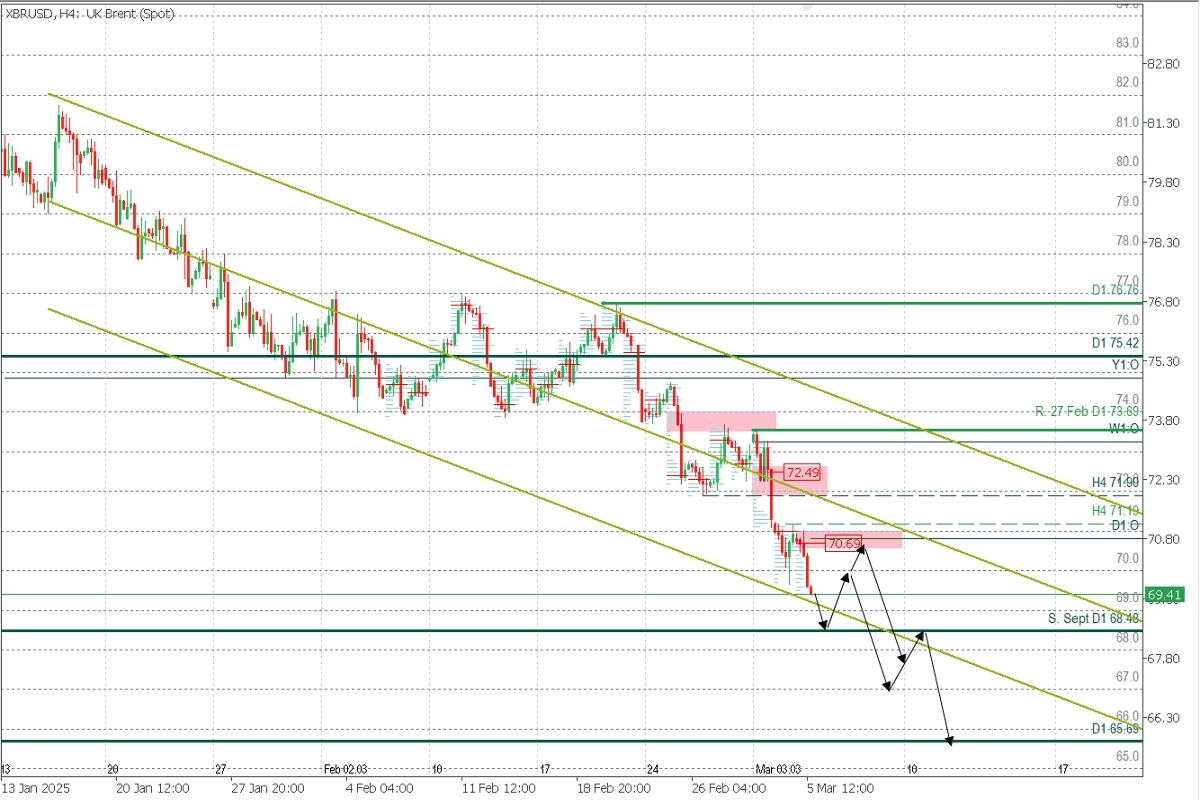
Crude oil continues its macro downtrend (daily chart), reaching September lows and the lower boundary of the linear regression channel drawn from January highs. After hitting the September support at 68.48, prices may initiate a correction toward recent supply zones around 70.69 or, more extensively, toward the broken support at 72.00.
A rebound toward the first supply zone near 70.69 may act as resistance, defended by bears, potentially triggering a new price drop toward 67.00 and 66.00, close to the December 2021 support at 65.69. A further decline toward the September support at 68.48 or even the psychological round level at 68.00 could accelerate the bearish trend.
Under the current scenario, the last validated intraday resistance is at 73.55, but a drop toward 68.00 would validate the 71.19 level as resistance. This implies that as long as the last key resistance remains unbroken, the bearish trend will continue.
Technical Summary
- Bullish Corrective Scenario: Buy positions above 68.48 targeting 70.00 and 70.70, from where to resume selling.
- Bearish Post-Correction Scenario: Sell positions below 70.70 targeting 68.00, 67.00, 66.00, and 65.70.
Always wait for the formation and confirmation of an Exhaustion/Reversal Pattern (ERP) on M5 as taught here before entering any trade in the key zones indicated.
POC Explained: POC = Point of Control: The level or zone where the highest concentration of volume occurred. If previously followed by a downward movement, it is considered a sell zone and forms a resistance area. Conversely, if followed by an upward impulse, it is considered a buy zone, usually located at lows, forming support areas.


